2026 YourCause Canadian CSR Industry Spotlight
Chapter 6 Preview
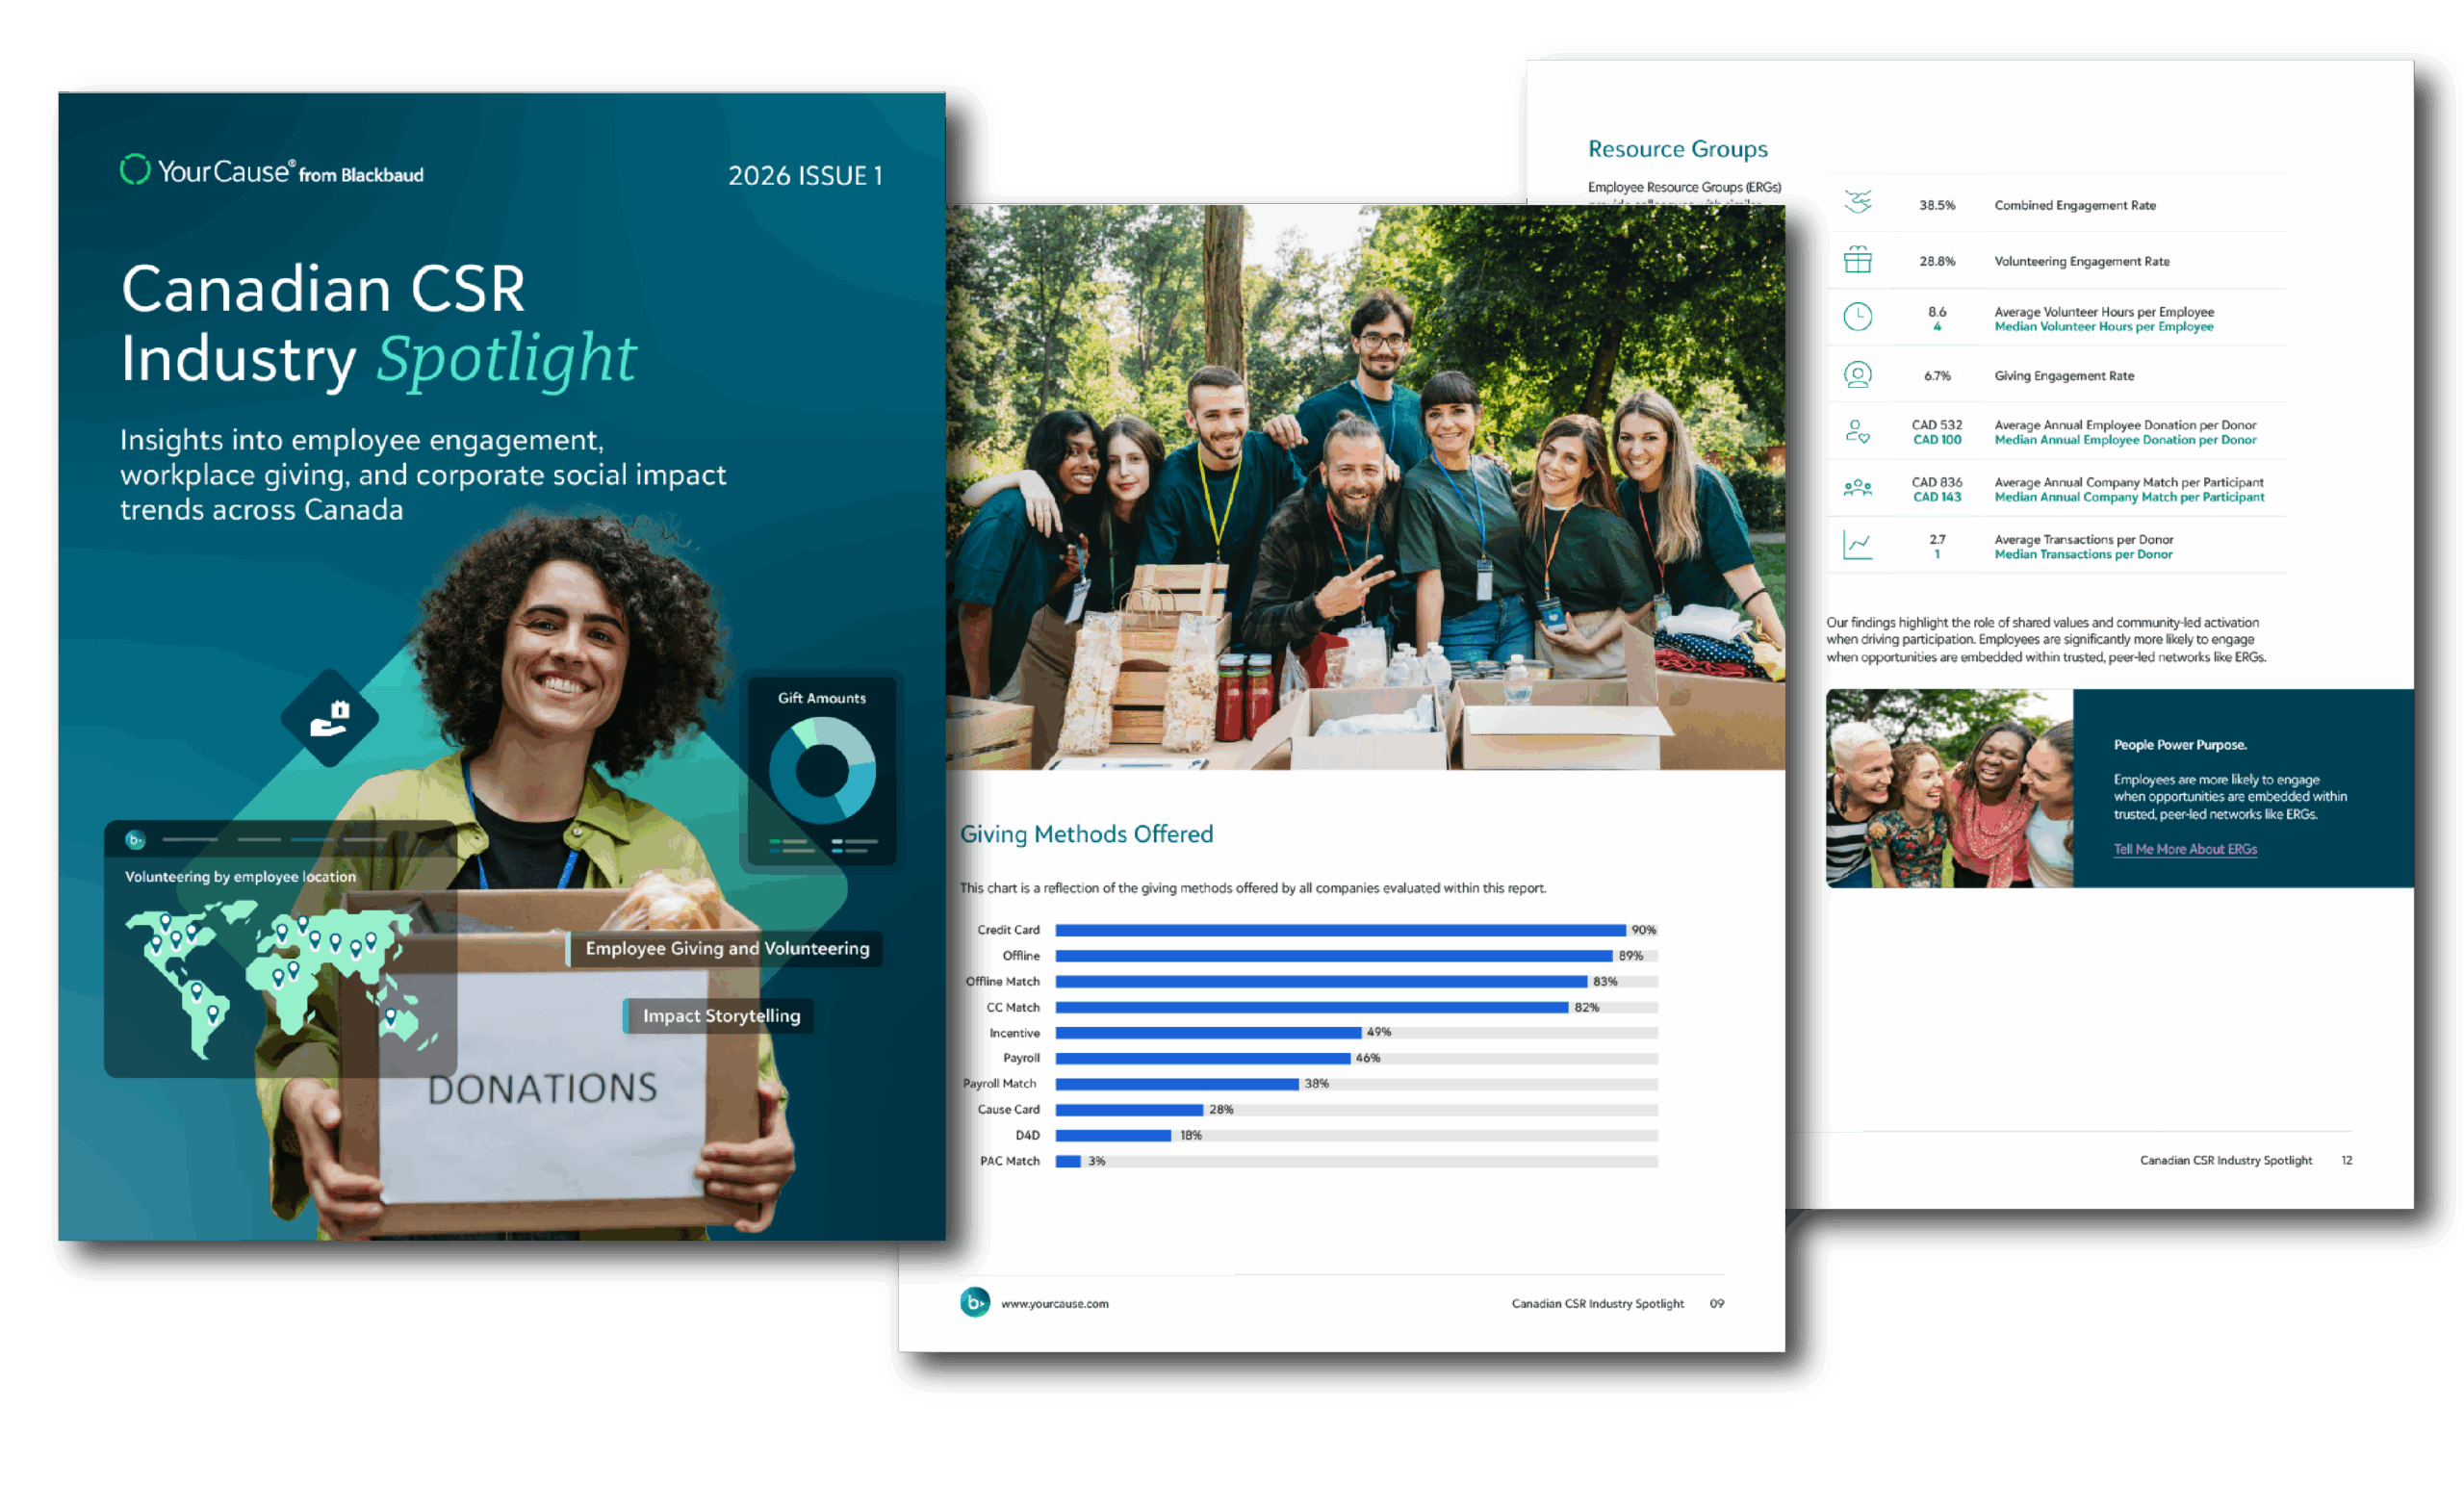

Welcome to our first-ever YourCause Canadian Industry Spotlight, where we take you inside the latest trends in employee engagement, corporate giving and grantmaking, community involvement, and social responsibility across Canada.
Using real-world data from 118 companies, this report reveals how Canadian employees are choosing to give back, and how their employers are supporting that participation.
From key trends around philanthropic behaviour to the top causes employees want to support, you’ll find practical takeaways and essential benchmarking data to help build CSR programs that align with your company culture, engage your employees, and drive meaningful impact in the communities you serve.
The observations presented in this report are based on data collected through the YourCause® CSRconnect® and GrantsConnect® platforms. The 2026 edition consolidates data gathered between January and December 2025. All insights are shared with the employee engagement and social responsibility community to ensure they are equipped with the latest research and best practices in the field.
Here is a sample of Chapter 6 of the report:
Company Size Data
This section evaluates employee engagement by segmenting companies by their global employee population size. Company size was determined by human resource reports on the number of employee records. Note: this is the size of the company’s workforce globally, not just in Canada.
| Data grouped by workforce size | 1–1,000 | 1,001–5,000 | 5,001–10,000 | 10,001–50,000 | 50,001–100,000 | 100,000+ |
|---|---|---|---|---|---|---|
| Combined Engagement | 34.3% | 15.1% | 31.0% | 9.8% | 39.8% | 6.5% |
| Volunteering Engagement | 34.3% | 27.7% | 12.2% | 7.3% | 41.8% | 4.0% |
| Giving Engagement | 6.1% | 3.5% | 20.1% | 4.3% | 3.8% | 4.8% |
| Average Annual Employee Donation per Donor Median Employee Donation |
CAD 732 CAD 200 |
CAD 337 CAD 155 |
CAD 521 CAD 206 |
CAD 1,160 CAD 128 |
CAD 658 CAD 106 |
CAD 328 CAD 141 |
| Average Annual Company Match per Participant Median Company Match |
CAD 719 CAD 200 |
CAD 341 CAD 131 |
CAD 403 CAD 112 |
CAD 584 CAD 167 |
CAD 1,011 CAD 264 |
CAD 916 CAD 100 |
Average Hours per Volunteer Median Hours per Volunteer |
4.2 2.5 |
7 5 |
8.4 4 |
7.7 4 |
9.5 4 |
7.6 4 |
Percentage of Virtual Volunteer Hours |
1.9% | 3.3% | 10.9% | 6.1% | 4.8% | 8.6% |
Mid‑ to large‑sized organizations (particularly those with 50,000–100,000 employees) demonstrate some of the highest levels of combined and volunteering engagement, while the largest enterprises (100,000+ employees) show the lowest participation overall.
Smaller organizations (under 1,000 employees) also perform strongly (particularly in volunteering); but the data shows that engagement is not driven by size alone. Instead, participation appears to be influenced more by how programs are structured and delivered than by the size of the organization itself.
This variation likely reflects structural realities. Smaller organizations often benefit from closer proximity and clearer communication, while mid‑sized organizations may strike the right balance between scale and accessibility. In contrast, larger enterprises can struggle to maintain visibility and relevance across a dispersed workforce.
To drive stronger participation at scale, organizations should focus on localizing their approach. This includes empowering regional teams or ERGs to lead activity, creating location‑specific opportunities, and tailoring communications to reflect local communities rather than relying on one‑size‑fits‑all campaigns. When participation feels visible, relevant, and easy to engage with at a local level, organizations of any size can begin to close the engagement gap.
Before diving into the best practices of accounting for restricted funding, it’s important to understand the foundation it’s built on: fund accounting.
Fund accounting is the financial framework that sets social impact organizations apart from for-profit businesses. Instead of focusing on profitability, organizations prioritize mission fulfillment and accountability. Fund accounting enables organizations to segregate resources by purpose—such as general operations, restricted grants, or donor-designated funds—so every dollar is tracked according to its intended use within one system. No army of spreadsheets to track specific grants and programs.
The fund accounting approach is essential because nonprofits, foundations, agencies, and educational institutions often manage multiple revenue streams with unique restrictions. Donors and grantors expect transparency and proof that their contributions are used as promised. Fund accounting systems make this possible by recording transactions within self-balancing funds and ensuring compliance with regulations like FASB’s ASU 958 and GASB Statement No. 34, which requires clear reporting of net assets with and without donor or funder restrictions.